05.1.5 / Data & Results
From Sample Reading to Design Input.
The field tests produced site- and weather-based sample records rather than a final scientific answer. By comparing sample images, temperature records, and reading guides, we treated the data as design input for translating invisible water conditions into public-facing signals.
Sample Before / After Images
Brooklyn Bridge Park
Sunny
Before
Brooklyn / Sunny / Before
After
Brooklyn / Sunny / After
Brooklyn Bridge Park
Rainy
Before
Brooklyn / Rainy / Before
After
Brooklyn / Rainy / After
Newtown Creek
Sunny
Before
Newtown / Sunny / Before
After
Newtown / Sunny / After
Newtown Creek
Rainy
Before
Newtown / Rainy / Before
After
Newtown / Rainy / After
Data Records
Brooklyn Bridge Park
Sunny
Brooklyn Bridge Park / Sunny / Data Record
Brooklyn Bridge Park
Rainy
Brooklyn Bridge Park / Rainy / Data Record
Newtown Creek
Sunny
Newtown Creek / Sunny / Data Record
Newtown Creek
Rainy
Newtown Creek / Rainy / Data Record
Use horizontal data screenshots for each site-and-weather condition.
How to Read the Sample
Official Aquagenx Reaction / Color Reading Table
Use the official reaction chart image here.
05.1.5 / Data & Results
From Sample Reading to Design Input.
The field tests produced site- and weather-based sample records rather than a final scientific answer. By comparing sample images, temperature records, and reading guides, we treated the data as design input for translating invisible water conditions into public-facing signals.
Sample Before / After Images
Brooklyn Bridge Park
Sunny
Before
Brooklyn / Sunny / Before
After
Brooklyn / Sunny / After
Brooklyn Bridge Park
Rainy
Before
Brooklyn / Rainy / Before
After
Brooklyn / Rainy / After
Newtown Creek
Sunny
Before
Newtown / Sunny / Before
After
Newtown / Sunny / After
Newtown Creek
Rainy
Before
Newtown / Rainy / Before
After
Newtown / Rainy / After
Data Records
Brooklyn Bridge Park + Newtown Creek
Sunny
Sunny Condition / Comparison Visualization
Brooklyn Bridge Park + Newtown Creek
Rainy
Rainy Condition / Comparison Visualization
Use one comparison chart for sunny conditions and one comparison chart for rainy conditions.
How to Read the Sample
Official Reaction / Color Reading Table
Use the simplified reading chart image here.
The field tests produced both negative and positive trials. These results
helped us understand how water conditions varied across sites and weather conditions. They also showed how difficult it is to communicate microbial risk simply, which became an important design challenge for the installation.
Instead of treating the data as a final answer, we used it as a design input. The experiment helped us think about how uncertainty, delay, and invisible contamination could be translated into a public visual language.


Group 02
Site Observation
Group 02
Temperature
Group 02
Water Sample
Group 02
Growth Medium
Group 02
Result
Procedure
Field
Process.
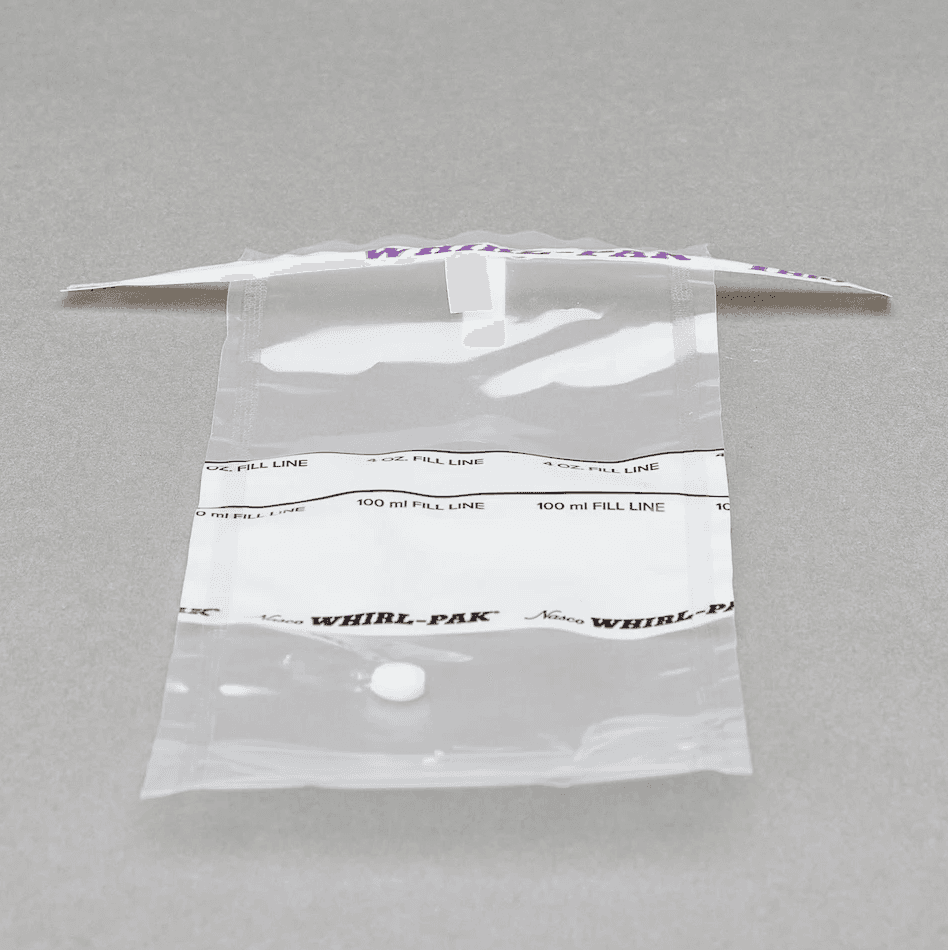
At each site, we documented visible conditions, measured temperature, collected water samples, and prepared them for E. coli presence / absence testing. Since the fieldwork was carried out in two groups, each step can be shown through two parallel image records.
01 / Observe
Group 01
Site Observation
02 / Measure
Group 01
Temperature
03 / Collect
Group 01
Water Sample
04 / Mix
Group 01
Growth Medium
05 / Read
Group 01
Result


Site Observation
Record visible water and surrounding conditions.
Temperature
Hold the sensor in water for one minute.
Water Sample
Collect a labeled 100 mL sample.
Growth Medium
Mix the sample with testing medium.
Result
Read the color change after the waiting period.

materials as translation tools.
experiment porpose


two waterfronts, two relationships to risk.
Testing Sites
We compared waterfront sites including Brooklyn Bridge Park and Newtown Creek because they represent different relationships between public access, recreation, infrastructure, and water contamination. Brooklyn Bridge Park has high public visibility and recreational use, while Newtown Creek has a stronger relationship to industrial infrastructure and CSO-related concern.


The field experiment tested how water temperature and E. coli presence/absence results varied across sites and weather conditions. The goal was not to produce a complete scientific model, but to ground the design in real measurements and explore how environmental signals might become public-facing.

experiment
purpose
design question
how can enviromental data become
public-facing?
experiment porpose
FIELDWORK
&ECPERIMENT


THE FIELD EXPERIMENT TESTED HOW WATER TEMPERATURE
AND E. COLI PRESENCE / ABSENCE RESULTS VARIED
ACROSS SITES AND WEATHER CONDITIONS.
